Donate!

Showing posts with label pressure. Show all posts

Sunday, November 19, 2017

Surface Weather Elements

Station Plots


  • Station "plots" or "model" are used to spatially display the current conditions in a particular region.


Current Plots

Test Yourself


Isoplething
  • The analysis process represents only one step in the production of an analysis chart. The construction of isopleths can entail either subjective or objective analysis schemes.

  • Subjective analysis refers to a hand-drawn product, where a meteorologist draws isopleths based upon visual interpolation between the irregularly distributed data points, coupled with continuity from previous charts, experience and intuition.

  • Objective analysis typically refers to computer generated products, where the isopleths are generated by numerical interpolation schemes involving an organized grid representation of the given field.

  • On the surface map there are many more stations to provide information and the following information is given to you:
    • Wind speed and wind direction (wind barb at each station)
    • Isobars drawn at 4-mb intervals
    • Areas of relatively High (H) and Low (L) pressure.

  • As one studies the sequence of the three surface maps one sees how both the surface fronts and the areas of low and high pressure move. These features are:
    • Transient
    • Linked to what's going on at 500-mb! Dynamic!

  • Matter of fact, the activity associated with upper-level troughs (movement, location, development) dictates the movement, location and development of the surface low- and high-pressure systems!

  • One thing to do in any sequence is pick a location, let's say St. Louis and examine how the surface characteristics change with time. 

Sea-level pressure, surface winds, and frontal positions at 00, 09, and 18 UTC 10 Nov 1998. The dashed blue line denotes the cold front. The contour interval for sea-level pressure is 4 hPa. [Atmospheric Science, Wallace & Hobbs]


Surface air temperature (in degrees celsius) and frontal positions at 00, 09, and 18 UTC 10 Nov 1998.  [Atmospheric Science, Wallace & Hobbs] 


Winds and Pressure
  • Wind is plotted vectorially, showing the direction from which the wind is coming from.

  • It tends to blow across the isobars going from higher pressure to lower pressure at and near the surface.
    • This flow across the isobars is due to friction.

  • As you examine the maps you will see that areas of high pressure are separated by troughs of lower pressure.

  • A surface trough represents an area of convergence or a line of confluence where air is flowing together in the wind field. The confluence line is generally represented by some type of front.

  • Areas of surface low-pressure develop along the confluence line.

  • Generally ahead (or to the east) of the surface low pressure the confluence line moves northward (with southerly winds) while behind (or to the west) of the surface low pressure the confluence line moves southward (with northerly winds).

  • Counterclockwise (cyclonic) circulation develops around the surface low

Station Models. Wind entries. [Aguado and Burt 411]


Temperature and Fronts
  • Surface temps can be plotted.  Once plotted these values represent an excellent way to define frontal location.

  • As one can clearly see the temp. north of the convergence or confluence line are much cooler than those south of it.  This is typically the case in the N.H. (weaker differences in the summer than winter).
    • Gulf air (warm, moist) -- mT
    • Canadian air (cool, dry) -- cP

  • If we compare temps to where the wind is blowing from, the relationship between temps and wind direction can be drawn.

  • In the warm air region south of the confluence line the temps appear horizontally homogeneous. This is expected in a air mass.
Idealized cross sections through frontal zones showing air motions relative to the ground in the plane transverse to the front. Colored shading indicates the departure of the local temperature from the mean temperature of the air at the same level. (a) Warm front. (b) Stationary front. (c) Cold front. Heavy arrows at the bottom indicate the sense of the frontal movements. [Wallace and Hobbs 321]
Surface air temperature (in degrees celsius) and frontal positions at 00, 09, and 18 UTC 10 Nov 1998.  [Wallace and Hobbs 324] 


Fronts

  • Because the confluence line, a boundary, separates relatively cool air from warm air we call it a front.

  • The region of strong thermal contrast on the "cold air side (poleward)" of the confluence line is called a frontal zone or baroclinic zone.
    • It is the zone, not the front, that separate the cool and warm air masses.  The front represents the warm air boundary of the frontal zone and coincides with the line of confluence in the wind field.

  • Fronts are named based on the direction of movement:
    • Cold air advancing → cold front (triangles on front)
    • Cold air retreating → warm front (semi-circles on front)

  • The direction of the front movement is based on the side of the front the symbols are located and direction they are pointing.

  • Stationary fronts are denoted by alternating cold and warm front symbols on different sides.


  • A transition zone between two air masses of different densities (temp) and humidities.
  • They are important not only for temp. and humidity changes they bring but also for the uplift they cause (frontal “wedging”).
  • Four primary types:
    • Cold
    • Warm
    • Stationary
    • Occluded
Frontal symbols used on surface weather maps. [Robert et al. 166]

  • Identifying Fronts:
    • Sharp horizontal temperature change
    • Sharp horizontal dewpoint/humidity temperature change
    • Shift in the wind direction
    • Presence of clouds & precipitation
    • Change in pressure

  • Frontal Characteristics
    • Why do fronts move?  Examine the vertical cross sections normal to the fronts which are moving.
    • Air within the frontal zone is "trapped" in the shallow wedge beneath the frontal surface and thus can not move relative to the front, or conversely, the front can not move relative to it.
    • The direction and speed of movement of the front is determined by the winds within the frontal zone.
    • In warm front situation -- cold air retreats poleward and warm air tied to southerly winds tries to push up the frontal surface -- providing for the development of layered clouds (aka stratus).
    • In cold front situation -- cold air (associated with northerly winds) advances southeastward forcing the warm air to rise vertically -- giving way to vertically developed clouds.

  • Temperatures and Fronts
    • Role of fronts in mediating surface temps is important, but other factors influence surface temps including: time of day, sky cover, altitude of the station, and proximity to water
    • These can exert an equally important role of influencing temps

  • Fronts are often difficult to locate because...
    • Over oceans, temps are strongly influenced by underlying water (sea surface temps do not change much over a short distance)
    • In mountainous terrain, large difference in station elevation mask the temp gradients
    • Terrain effects, nocturnal inversions, convection, and UHI can all affect temps.


Moisture and Dew Point
  • Similar to the steep temp. gradients located along lines of confluence, we see horizontal gradients of dew point.
    • Steep gradient (continental vs. maritime air)
    • Weak gradient (cool maritime vs. warm maritime air)

  • In some situations the dew point gradient is a more reliable indicator; especially in summer when temp. differences near fronts are small.

  • Dryline is the boundary between  marine and continental air masses.
    • Forms due to land-sea geometry and terrain features.
    • Typically form during warm season and are situated meridionally across the southern and central Great Plains.


Precipitation
  • The distribution of fog and precip. is very much related to the location of the front.

  • Early on, the precip. is located north of the stationary front because the warm air overruns the sloping frontal surface.  The snow continues along the front-range of the Rockies as easterly surface winds push the air up the mountain range, lifting mechanism.

  • Eventually, the precip will become of greater intensity and will increase in areal coverage due to the surface low and upper air trough deepening causing more surface convergence.

  • Fog exists along the warm front and north of the stationary front. Fog is common when warm, moist air passes over a colder, underlying surface.

  • The band of precip. associated with the cold front is generally more intense but in narrow bands.  Often t-storms will occur along the cold front


Precipitation Tendency

  • Passage of warm front is associated with a leveling off of the pressure (warm, moist air).


  • Passage of cold front triggers a rise in the surface pressure.

  • Pressure rises after a cold front are usually greater than the pressure falls which occur prior to the passage of a warm front.

  • In surface analysis, lines connecting points at which the same pressure tendency occurs are called isallobars.

  • The pressure falling in the vicinity of the low pressure indicates that the low is deepening as it moves.  With this comes stronger winds in the circulation around the low.

  • When interpreting small changes in pressure, the diurnal cycle in solar heating produces small but noticeable pressure fluctuations that have nothing to do with synoptic situation.  These are referred to as tidal fluctuations and should be removed before a true synoptic assessment.


Works Cited
Aguado, Edward, and James E. Burt. Understanding Weather and Climate. 7th ed., Pearson, 2014.
Rauber, Robert M., et al. Severe and Hazardous Weather: An Introduction to High Impact Meteorology. 4th ed., Kendall Hunt, 2014.

Wallace, John, and Peter Hobbs. Atmospheric Science: An Introductory Survey. 2nd ed., Academic Press, 2006.

Extratropical / Midlatitude Cyclones


  • Cyclone = any circulation around low-pressure.
  • Extratropical Cyclone = large low-pressure system that often form in the mid-latitudes.
  • Day-to-day weather in the mid- and high-latitudes is closely related to the location, development, and movement of cyclonic storms.
  • Cyclones are responsible for:
    • Changing air masses (temperature, dew point, wind, etc)
    • Bringing precipitation opportunities
  • Most weather is linked to extratropical cyclones, rather than being discrete weather events.
  • Vertically speaking, they're found in the tropopause.
  • Needed to balance temperature differences between the poles and equator (between the cold upper troposphere and the warm lower troposphere).

  • Most intense in the late fall, winter and spring due to the temperature gradient between the tropics and the north pole being the strongest during that time.
  • Winds blow counterclockwise (cyclonically) in the northern hemisphere and clockwise (cyclonically) in the southern hemisphere.
  • It forms at intersecting fronts:
    • Cold front is typically south and west, to east of the low.
    • Cold air is "behind" the low, while warm air is "ahead" (lows and highs both move in the direction of the jet stream winds).
    • Thunderstorms are often ahead of the cold front.
    • Steady precipitation is often ahead of the warm front.

  • Cloud Sequence: cirrus, cirrostratus, altostratus, nimbostratus


Norwegian / Bergen Cyclone Model

  • During WWI, Vilhelm Bjerknes identified that midlatitude cyclones formed along the boundary separating polar air from the warmer air to the south.
  • Widely used by weather forecasters to intercept and anticipate changes in the surface synoptic chart.
  • Most real cyclonic disturbances do not fit the model perfectly.
  •  Things that are difficult to identify:
    • Warm fronts
    • Problems with topography distorting / obscuring fronts.
    • Some storms develop away from the stationary front.
    • Fronts sometimes develop by themselves.


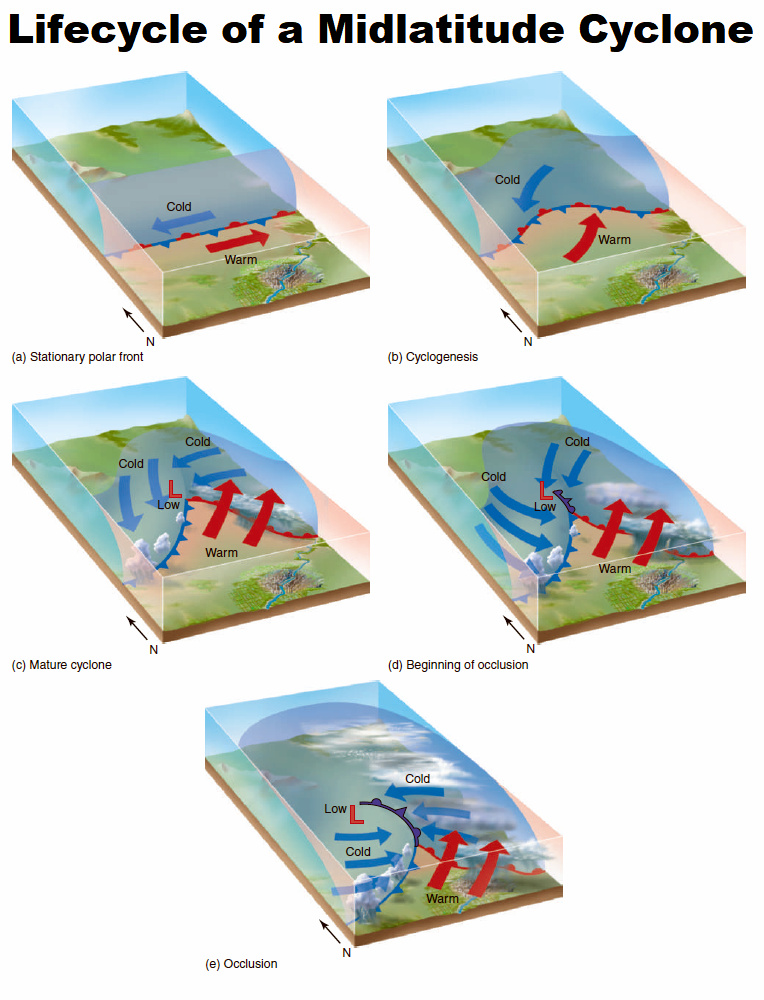
Life Cycle of a Midlatitude Cyclone. (a) According to the Norwegian model, the stationary polar front separates opposing masses of cold air and warm air. (b) Cyclogenesis first appears as a disruption of the linear frontal boundary. (c) The cyclone becomes mature; distinct warm and cold fronts extend from a low-pressure center. (d) Occlusion begins as the cold front catches up to the warm front. (e) Occlusion intensifies as more of the cold front catches up to the warm front. [Aguado and Burt 291]


Aguado, Edward, and James E. Burt. Understanding Weather and Climate. 7th ed.,  Pearson, 2014.


Tuesday, May 17, 2016

Sea Breeze / Land Breeze Circulations

Sea/Lake Breeze Front is a boundary that is usually small and temporary but usually causes an abrupt drop in temperature as it passes (a distinct boundary between the cooler maritime air and the continental air it displaces). Whereas, just a sea/lake breeze is heating over the inland area which causes air to expand upward and diverge at higher altitudes. This creates a surface low-pressure area and the sea breeze flows inland from the sea.
Pressure starts out equal over the land and sea/lake but due to unequal surface heating. The land is warmer due to the ground absorbing heat faster than the sea/lake, resulting in the ground heating the air by conduction. The less dense, warmer air is rising and expanding thus increasing the upper-level pressure and creating divergence above while, decreasing the pressure over the land. Whereas, over the sea/lake, the cooler and denser air which has a relatively higher pressure resulting in low-level convergence due to the fact that air flows from high to low pressure (pressure gradient force).
The strength of the breeze depends on the strength of the land-sea temperature difference (gradient). Sea/lake breezes occur mid to late afternoon when the land-sea temperature difference (gradient) is greatest and tend to be more intense than land breezes. Although, thunderstorms may develop if atmospheric instability is enhanced by surface heating.

Land breezes, on the other hand, are a reverse circulations that tend to occur during the pre-dawn hours. At night, the land surface cools more rapidly than the sea thus becoming denser resulting in a higher surface pressure and an offshore flow.

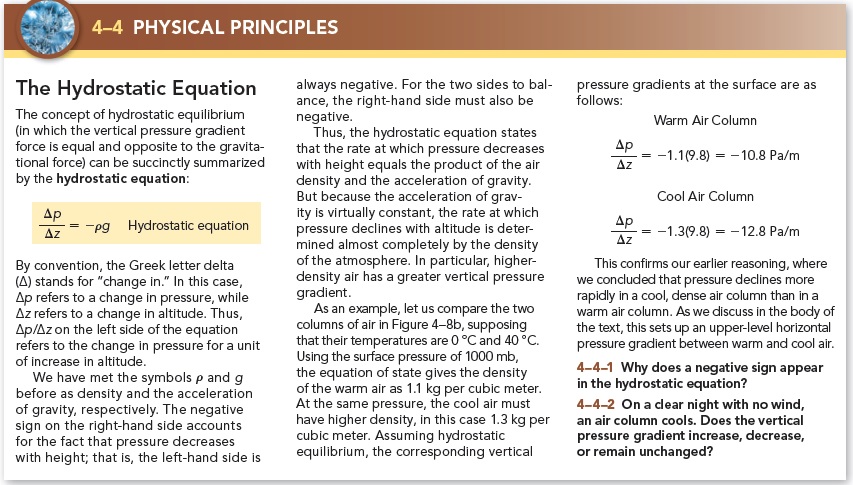
The Hydrostatic Equation

Hydrostatic Equation:

Hydrostatic Balance is when the net upwards force is equal to the downward force, requiring that the balance of forces in the vertical…
The pressure at height, z, is equal to the weight of the air in the vertical column of unit cross-section lying about that level.

Hydrostatic Equilibrium is when vertical pressure gradient force and the force of gravity are normally of nearly equal value and operate in opposite directions when…
     Gravitational force = vertical pressure gradient force in magnitude à no vertical acceleration occurs
     Gravitational force > vertical pressure gradient force à downward motion
     Gravitational force < vertical pressure gradient force à updrafts can develop that are associated with powerful thunderstorms.


Gradient Winds

Gradient Wind (or flow) develops only in the absence of friction, when considering curved flow and flows perpendicular to the contours, for the same reason as in geostrophic flow. However, gradient wind is not truly geostrophic because it is constantly moving, thus undergoing an acceleration. Nonetheless, this time, in order for the air to follow parallel to the contours there must consider the effects of the centrifugal force as well as the pressure gradient force and the Coriolis force.

Subgeostrophic Flow is when V < Vg, air curves cyclonically (counter-clockwise), and the CF needs greater than in the geostrophic case in order to balance the PGF.


Supergeostrophic Flow is when V > Vg, air curves anti-cyclonically (clockwise), and the CF does not need to be as great as in the geostrophic case in order to balance the PGF.

Putting it all together…


Geostrophic Wind (and Equations)

Geostrophic Wind is a nonaccelerating flow occurring only in the upper atmosphere (due to the lack of friction) and when the winds are considered at “steady-state” (when the PGF counterbalances the CF). In fact the geostrophic flow is simply a special case of gradient flow that arises when the wind flows parallel to the isobars.


Chinook, Santa Ana and Katabatic Winds

Chinook, Santa Ana and Katabatic winds are those that flow downslope in response to the distribution of high- and low-pressure systems over and near large mountain areas, where compressing of descending air leads to adiabatic warming.
Chinook winds, off the eastern slopes of the Rocky Mountains in North America, form due to air flowing across the range. Low-pressure systems east of the mountains cause strong winds to descend the eastern slopes. Although, sometimes the presence of a large mass of cold, dense air near the base of the mountain range may prevent a chinook from flowing all the way down the slope.

Santa Ana winds, contrary to what people believe, occur in response to a large area of high-pressure which descends toward lower elevations and warms by compression causing air to flow out of the Rockies, they are not warm because they pass over hot desert surfaces. When Santa Ana’s develop, the combination of hot, dry winds, low humidity, and an abundant source of fuel can set the stage for an extensive fire that destroys a great deal of land or property.


            Katabatic winds, on the other hand, originate when air is locally chilled over a high-elevation plateau, where the air becomes dense due to its low temperature and flow downslope. These very strong gusts and lulls of winds cover much of coastal Antarctica and Greenland. They also flow out of the Balkan Mountains towards the Adriatic coast, where they are called boras; whereas, in France, they flow out of the Alps into the Rhone River Valley and are called mistrals.


Buys-Ballot Law

In the Northern Hemisphere, with the wind at your back, low pressure is to your left (and high pressure is to your right) because winds travel counterclockwise (cyclonic) around low pressure zones, again, in the Northern Hemisphere.

Thursday, March 24, 2016

Jetstreaks and Associated Circulations


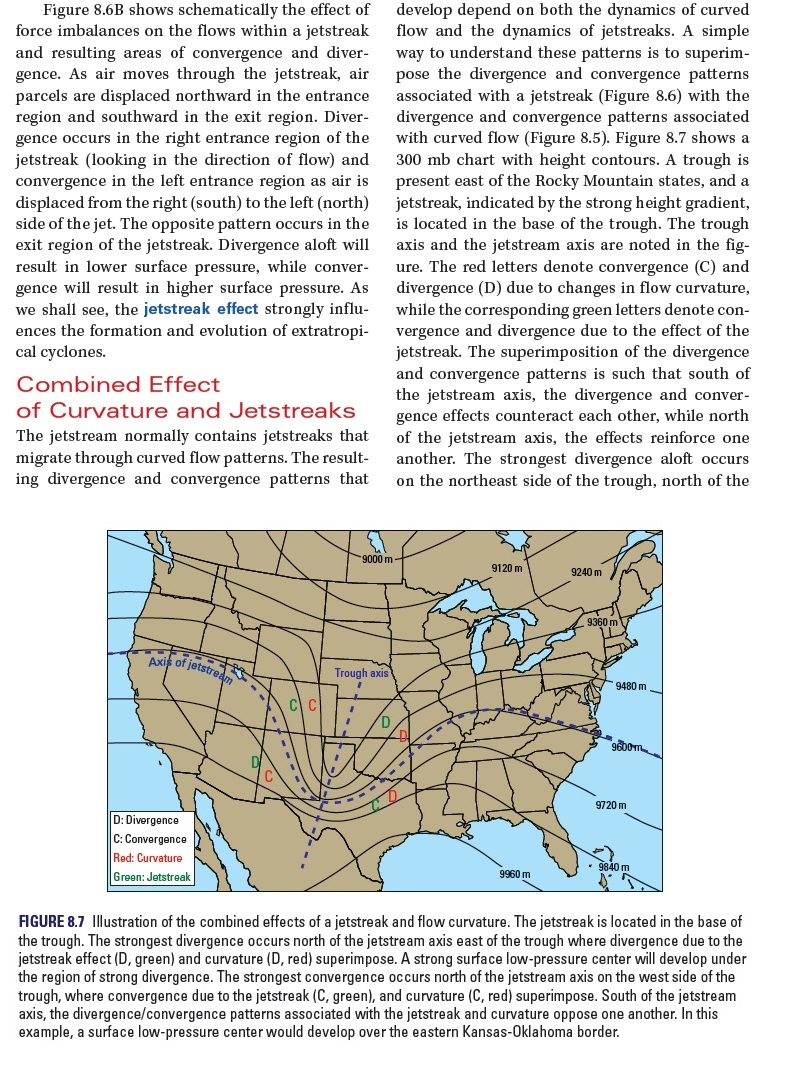
            A jetstream is a narrow band of strong winds that encircles the Earth in the mid-latitudes, containing regions where locally strong pressure gradients produce exceptionally strong winds, called jetstreaks, which migrate through curved flow patterns. A jetstreak is located in a region of strong pressure gradient and is indicated by the large values of isotachs (lines of constant wind speeds) and the close spacing of the pressure or height contours. As air moves through the jetstreak, air parcels are displaced northward in the entrance region and southward in the exit region. Divergence occurs in the right entrance region (looking in the direction of the flow) while convergence in the left entrance region displaces air from the right (south) to the left (north) side of the jet. Divergence aloft will result in lower surface pressure, whereas convergence will result in higher surface pressure.

            Although the jetstream is not always a single ribbon of fast-moving air encircling the pole. In nature, a single jetstream can split into two branches and then merge again at a downstream location. In fact, the most extreme low pressures associated with cyclones in the middle latitudes usually occur when two (or even three) jetstreaks, each embedded in a different branch, interact with one another as their parent jetstreams merge.


Wednesday, March 23, 2016

Weather Station Model

Temperature, pressure, moisture, and wind measurements are reported hourly at the surface (most are usually made 2 meters above the ground).

77: Temperature.

68: Dewpoint.

998: Pressure, to the nearest tenth of a millibar. Add either a 10 or 9 in front based on which would bring the value closer to 1000. The pressure here is 999.8 millibars (mb).

-03: Pressure tendency the last 3 hours, to the nearest tenth of a millibar. The pressure here has fallen .3 mb the last 3 hours.

Middle Circle (filled in w/ mostly black): Cloud cover. It's mostly black showing that this station is mostly cloudy. Technically, this represents a broken sky with 7/8 of the sky covered with clouds.

Black line, extending from circle: Wind barb. It points to where the wind is coming from. The wind here is from the southwest, hence a southwest wind. The two lines extending represent 20 knot winds with each line representing 10 knots.

Symbol between 77 and 68: This is the present weather field and in this case shows that there is a thunderstorm occurring at the station.

Symbol next to -03: That line is the pressure tendency. The 1st hour the pressure was steady, then fell the last two hours.

Triangle (with a dot above it): Previous weather, or the weather one hour ago. In this case it was a light rain shower.

How does the upper air station model differ from the surface station model?
     Temperature is given in Celsius
     Dewpoint depression is given not dewpoint temperature
     Altitude of the pressure surface is given instead of pressure
     Cloud cover is not noted

     Circles indicating station locations are often omitted


Newton's Three Laws of Motions

            Isaac Newton, the father of mechanics, is one of the most important scientists who ever lived, changing the standards by which scientists think today. His genius in mathematics and mechanics is exemplified by his creation of calculus to explain observations of the world around him. In addition, his laws of motion opened the door to progressive new thinking, enlightening the minds of thousands to the nature of things. His laws of motion make up the foundation for which dynamic meteorology exists.

1)    Law of Inertia—a body at rest or in motion will tend to stay that way until acted upon by a net external force.

2)    Law of Acceleration—a change in motion relates directly to a force trying to move it.
F = ma    or    F = ρg


3)    Action-Reaction Law—for every action there is an equal and opposite reaction.